
Time Log Teams
- Date: March 10, 2026 From: 4:30pm To: 4:50pm
- Date: March 11, 2026 From: 7:50pm To: 8:20pm
- Date: March 14, 2026 From: 6:30pm To: 7:10pm
Time Log Students
- Date: March 10, 2026 From: 5:30pm To: 5:50pm
- Date: March 11, 2026 From: 8:50pm To: 9:20pm
- Date: March 12, 2026 From: 2:20pm To: 2:40pm
- Date: March 14, 2026 From: 5:30pm To: 6:10pm
Essay I.
Summary of your activities in your contents including new contents created (one paragraph). Provide all the hyperlinks (clickable) of new contents you have created this week.
This week I expanded the content on my personal website by publishing two new reflective blog posts that explore themes of personal growth and life transitions. The first post, “Starting Over in Your Late Thirties,” discusses the challenges and opportunities that come with redefining your path later in life and emphasizes the clarity and intentionality that can come with starting over. The second post, “When You Thought You Found Your Purpose,” reflects on how our sense of purpose can evolve over time and how letting go of one path can lead to discovering a new one. These posts contribute to the blog by adding more personal storytelling and reflective content that connects life experiences with broader themes of identity, growth, and change.
New content created this week:
Essay II.
Summary of your KPI Table (add screenshots or table) (one paragraph).
Key Performance Indicators (KPIs) were identified to evaluate the performance of the website. The first goal focuses on increasing engagement with blog posts and photography content, measured through metrics such as page views, scroll activity, and user engagement. The second goal evaluates how effectively the website encourages visitors to explore multiple pages by tracking engagement rate and average engagement time. A third goal monitors visitor interest in learning more about me by analyzing page views for key pages such as the About and Blog sections. These KPIs were visualized in the Looker Studio dashboard using charts and tables to provide a clear overview of website performance and user behavior.
| Goal | KPIs | Metrics (Charts in Looker Studio) |
| Goal 1: Increase engagement with blog posts | Number of visitors interacting with site content. | Page Views, User Engagement, Scroll Events |
| Goal 2: Encourage visitors to explore multiple pages on the website. | Average session engagement and number of pages visited. | Engagement Rate, Average Engagement Time, Views per User |
| Goal 3: Track visitor interest in learning more about me. | Number of visits to key pages such as About, Blog, or Thank You pages. | Page Path Views, Sessions |
Essay III.
Summary of your Looker Studio Report with your KPI identified (add screenshots) (one paragraph).
The Google Looker Studio report was created to visualize key performance indicators (KPIs) for my website using Google Analytics 4 data. The dashboard includes charts that monitor important website performance metrics such as views, total users, and sessions over time. One KPI focuses on overall website traffic and engagement, measured through metrics such as page views, sessions, and total users, which are visualized in a time-series chart to show trends in visitor activity. Another KPI tracks visitor interaction with specific pages on the website, which is displayed in a table showing page paths, views, new users, and active users. These visualizations help identify which content attracts the most visitors and how users interact with the site. By organizing the data into charts and tables, the Looker Studio report provides a clear overview of website performance and helps evaluate how effectively the site engages visitors.
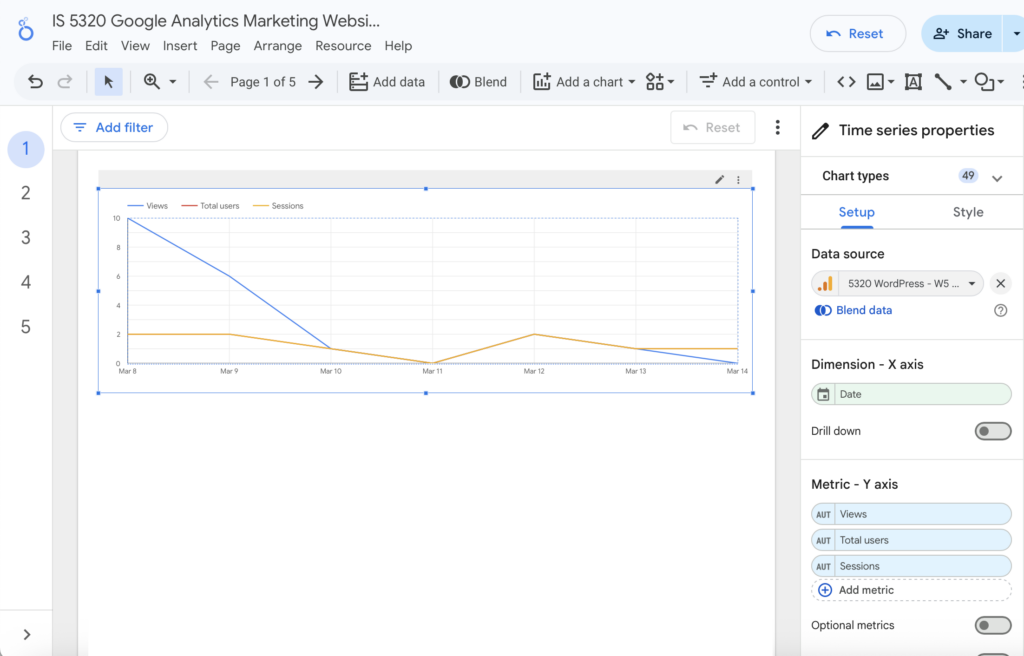
Figure 1. Time-series chart showing website traffic including views, users, and sessions.
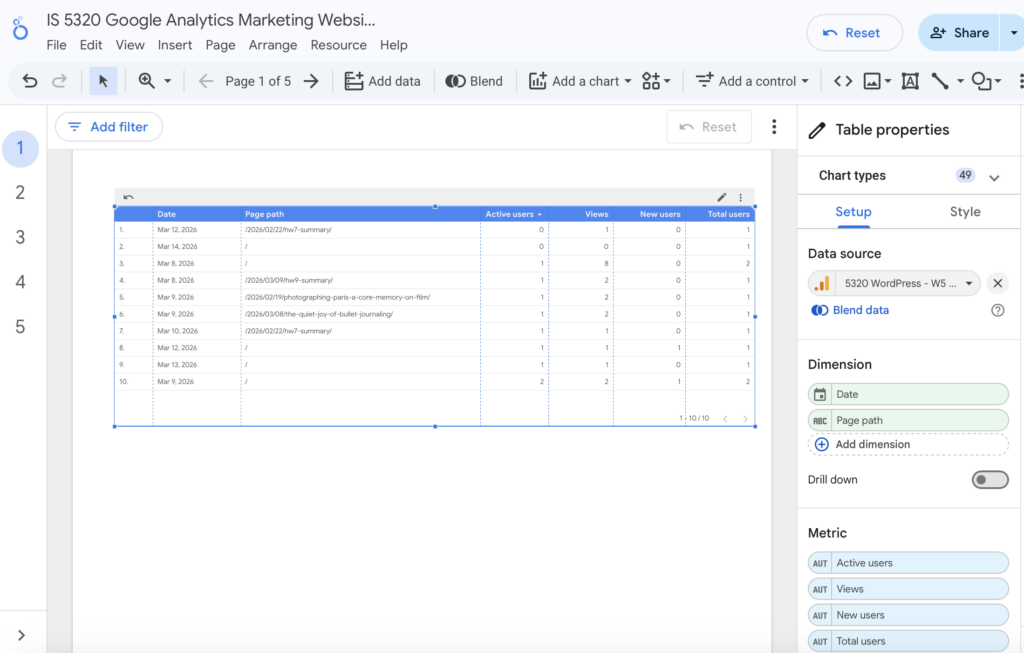
Figure 2. Table displaying page-level performance metrics including views and active users.
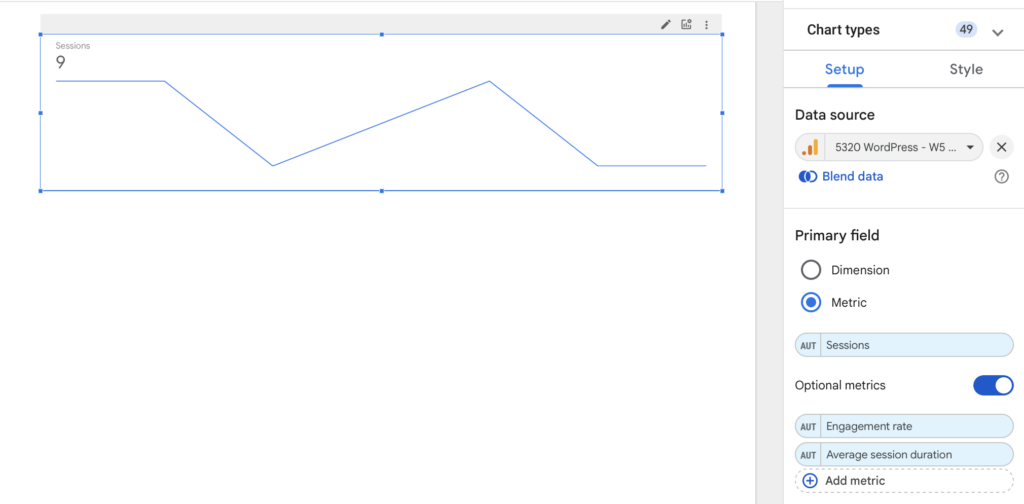
Figure 3. Session trend chart showing changes in visitor engagement over time.